Atola TaskForce: Main window
This article helps in understanding TaskForce’s main window, its controls and buttons and how to use them.
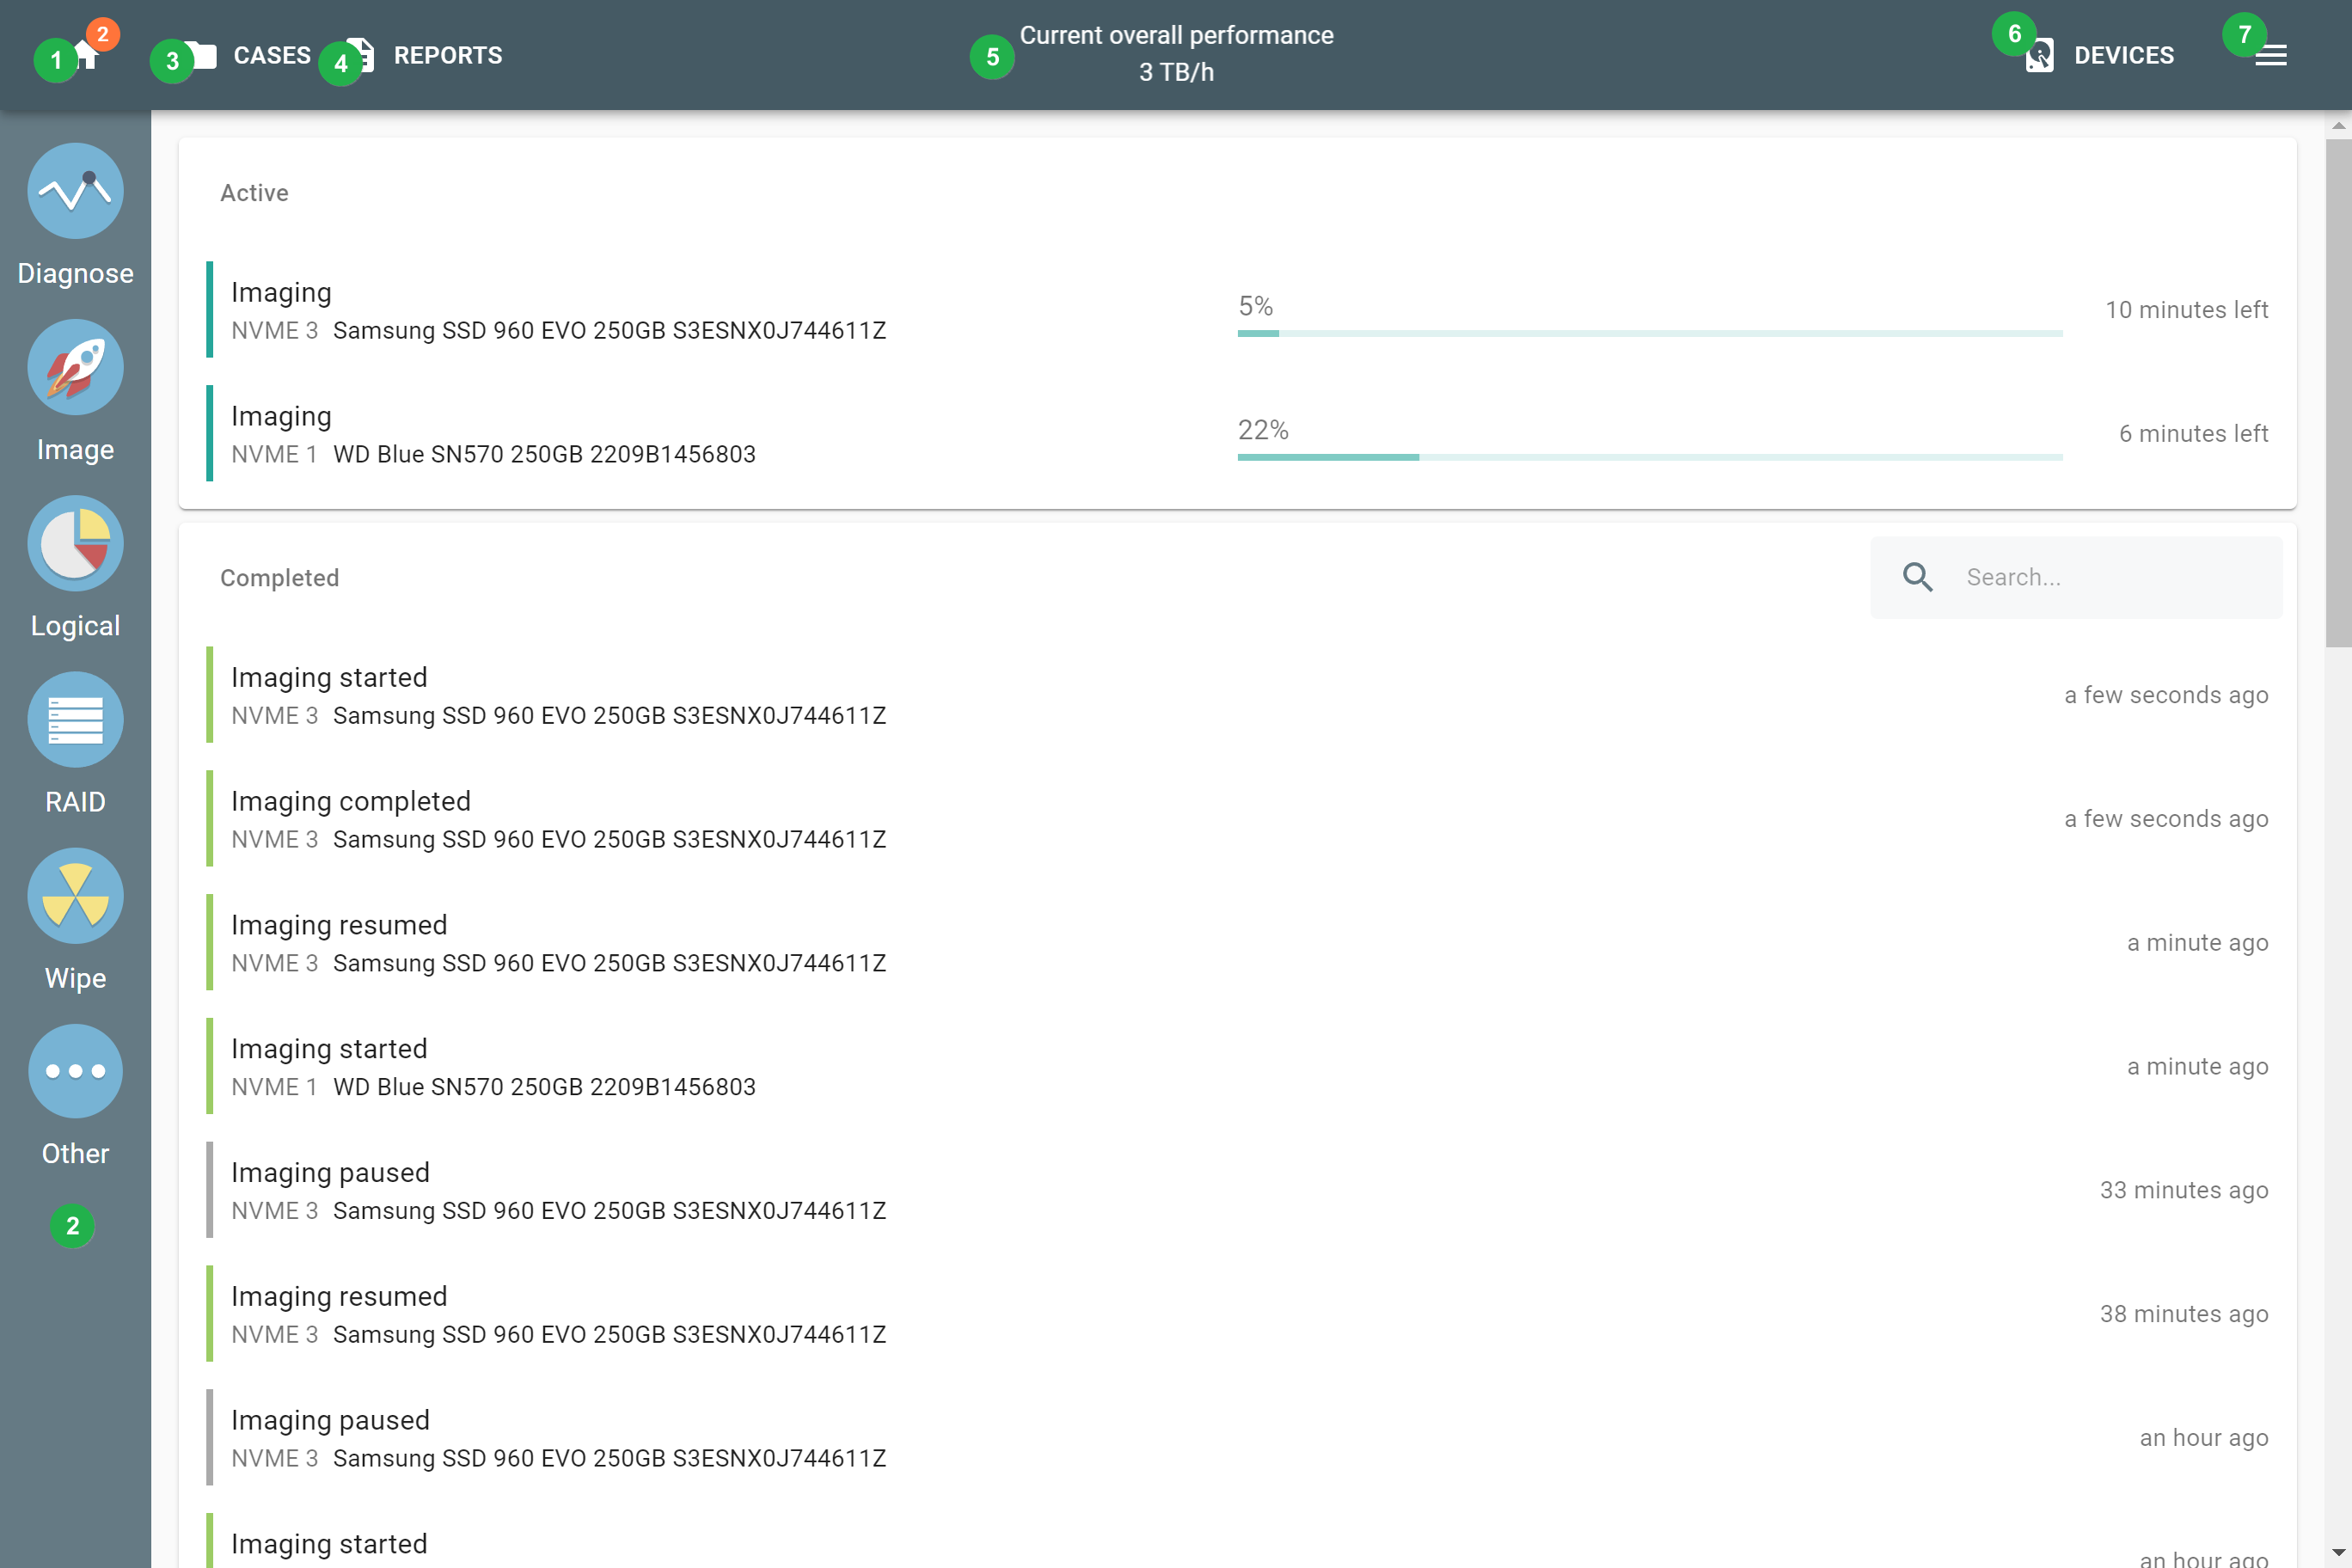
An overall view of the TaskForce 2 main window: 1 - Home icon, 2 - Taskbar, 3 - Cases button, 4 - Reports button, 5 - Current overall performance, 6 - Devices button, 7 - Menu.
1. Home icon
The Home button brings you back to the Home screen. This is where you can check the active and recently completed tasks in the respective sections of the screen.
The number of current active processes is indicated next to the Home icon in a small orange circle.
2. Taskbar
The Taskbar on the left shows main TaskForce operations:
- Diagnose
- Image
- Logical
- RAID
- Wipe
Click the Other button in the Taskbar to access 4 more important TaskForce operations:
- Hash: Calculates the hash of a device: MD5, SHA-1, SHA-256, SHA-512.
- View SMART: Shows all SMART attributes as a table.
- Browse files: Shows the content of partitions on a device.
- Hidden drive areas: Lets you unclip or change HPA, DCO, AMA limitations.
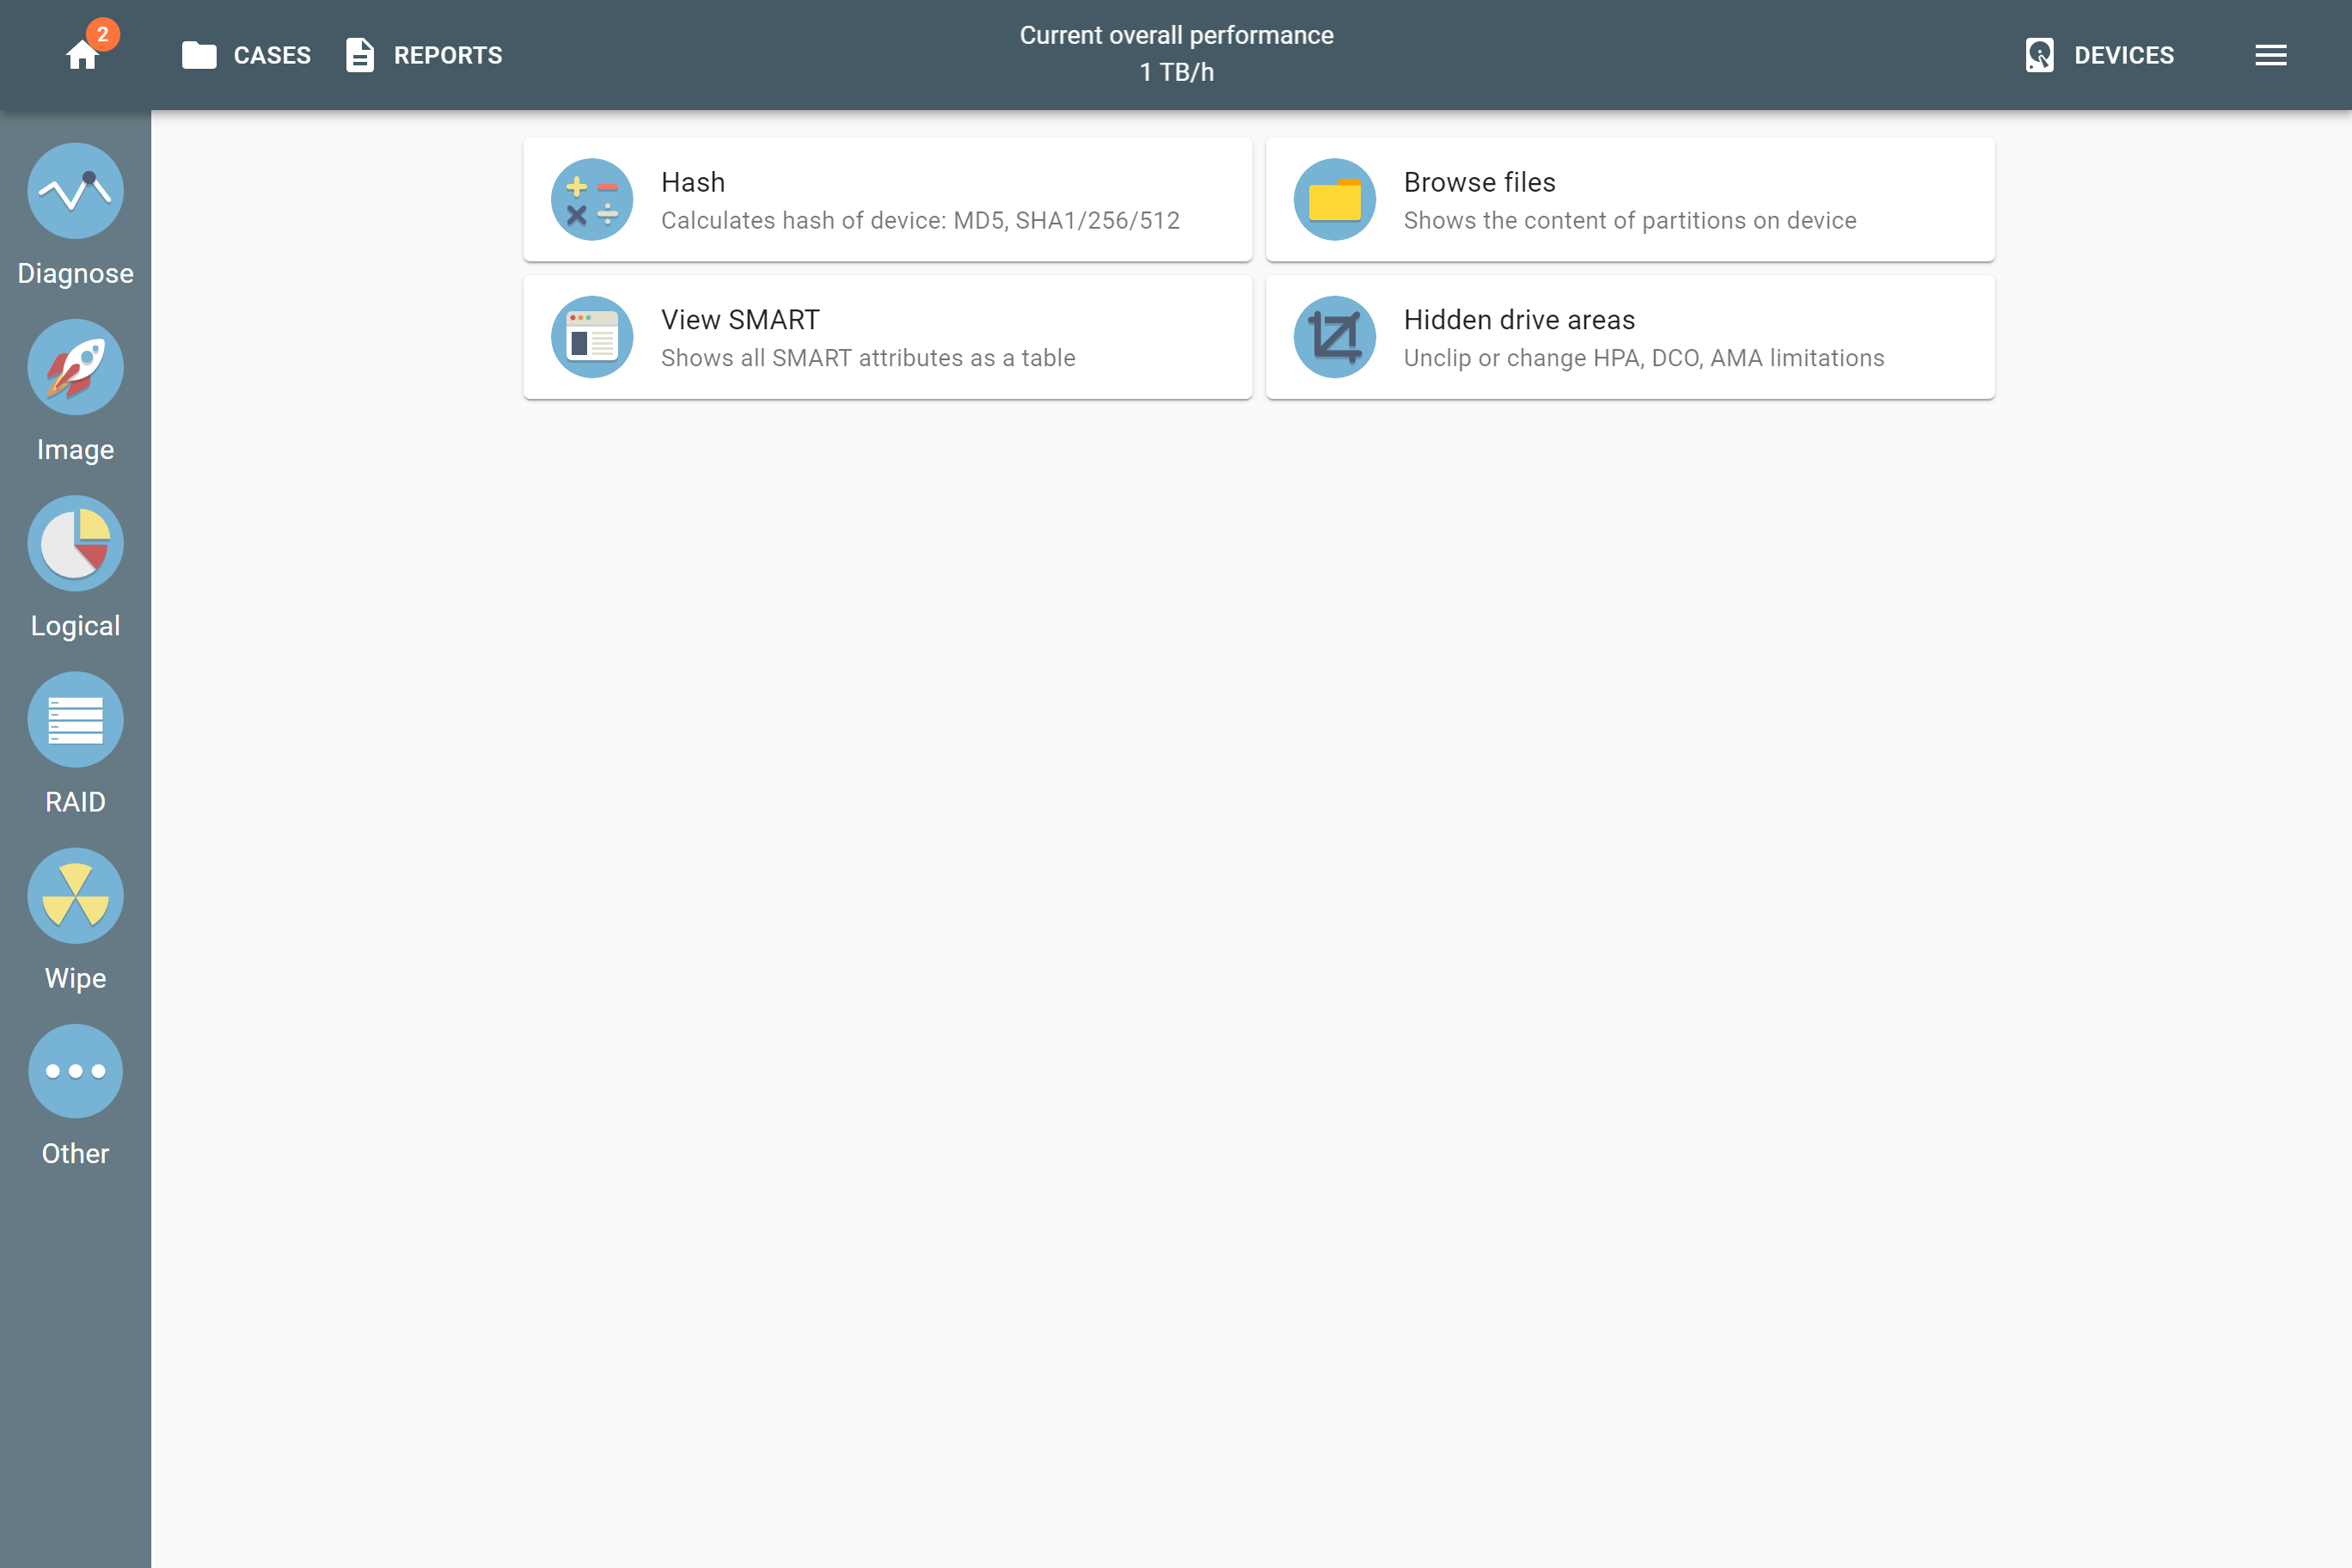
Section with other tasks: Hash, View SMART, Browse files, Hidden drive areas.
3. Cases
By clicking the Cases button in the top panel you get to the Cases page with a list of the latest cases. With the help of the Search bar you can find a specific case. The cases are available for import and export between different TaskForce units.

An overall view of the Cases page with a list of the latest cases.
4. Reports
By clicking the Reports button in the top panel you get to the Reports page that is equipped with a similar search bar. The reports can be selected and printed directly from this page.
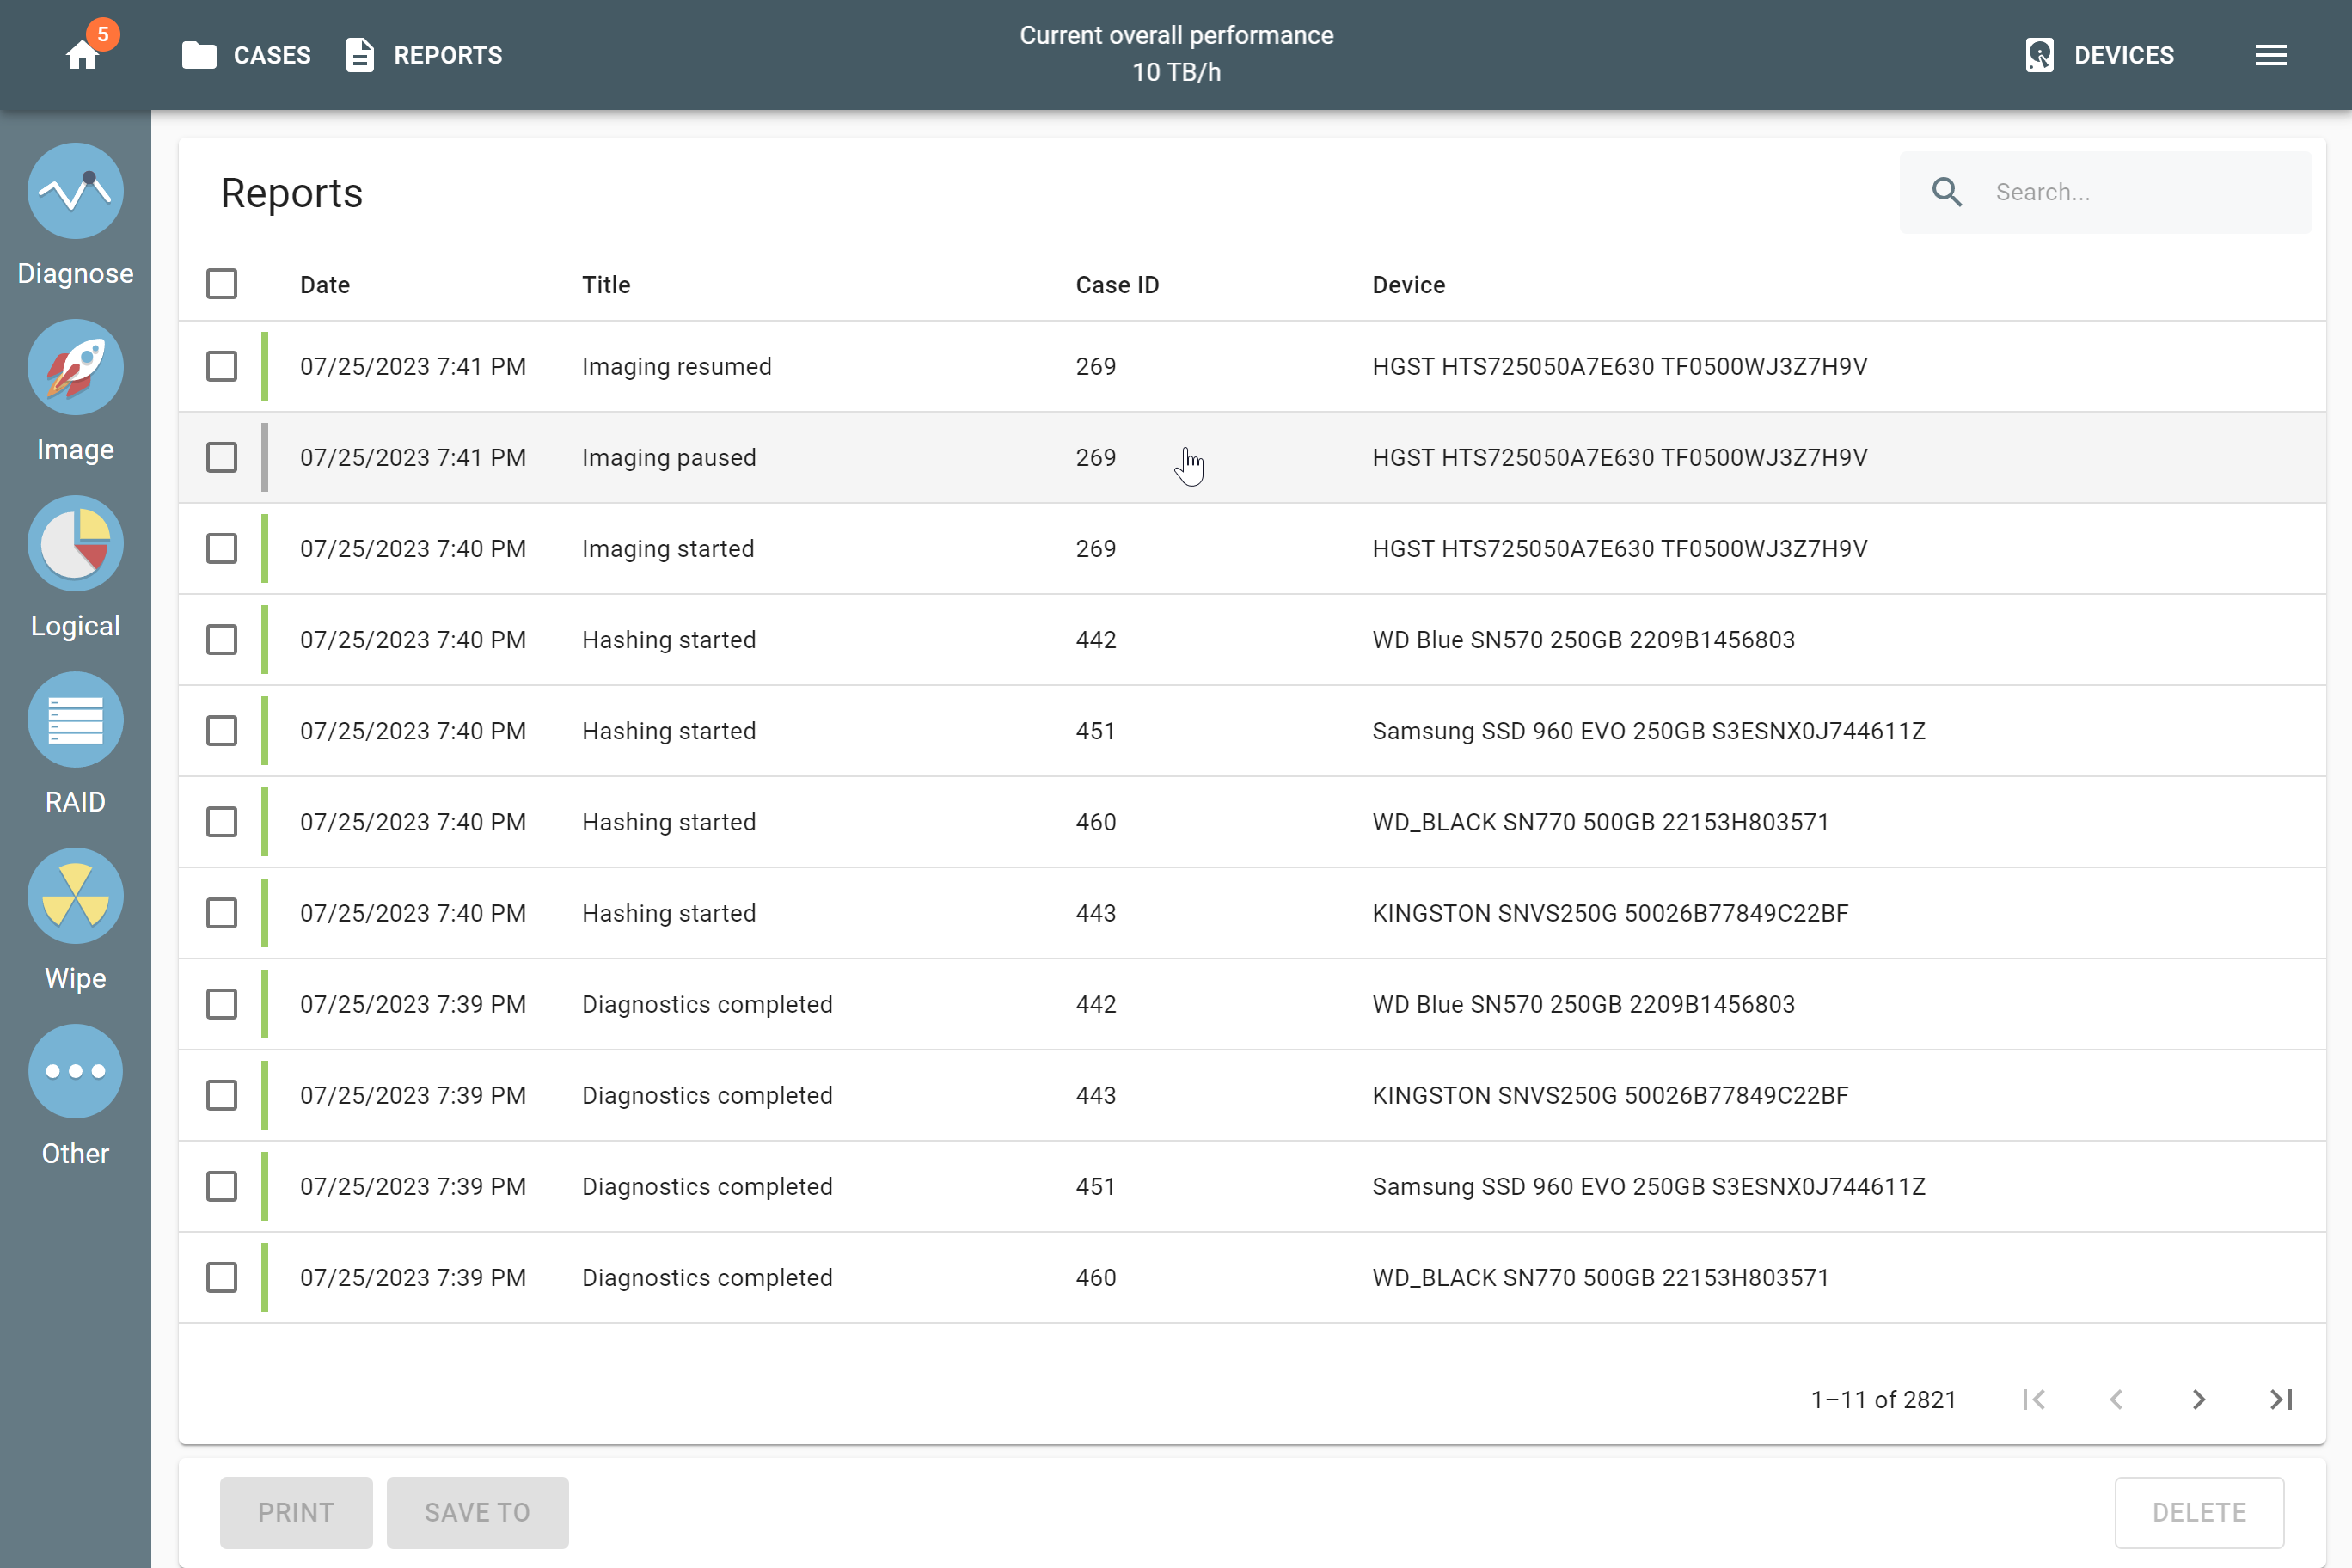
The Reports page with a list of the latest reports.
5. Current overall performance
To check the Current overall performance, click the Atola logo in the top panel. This lets you keep track of the unit’s capacity usage. TaskForce allows running processes at 25 TB/hour and more.
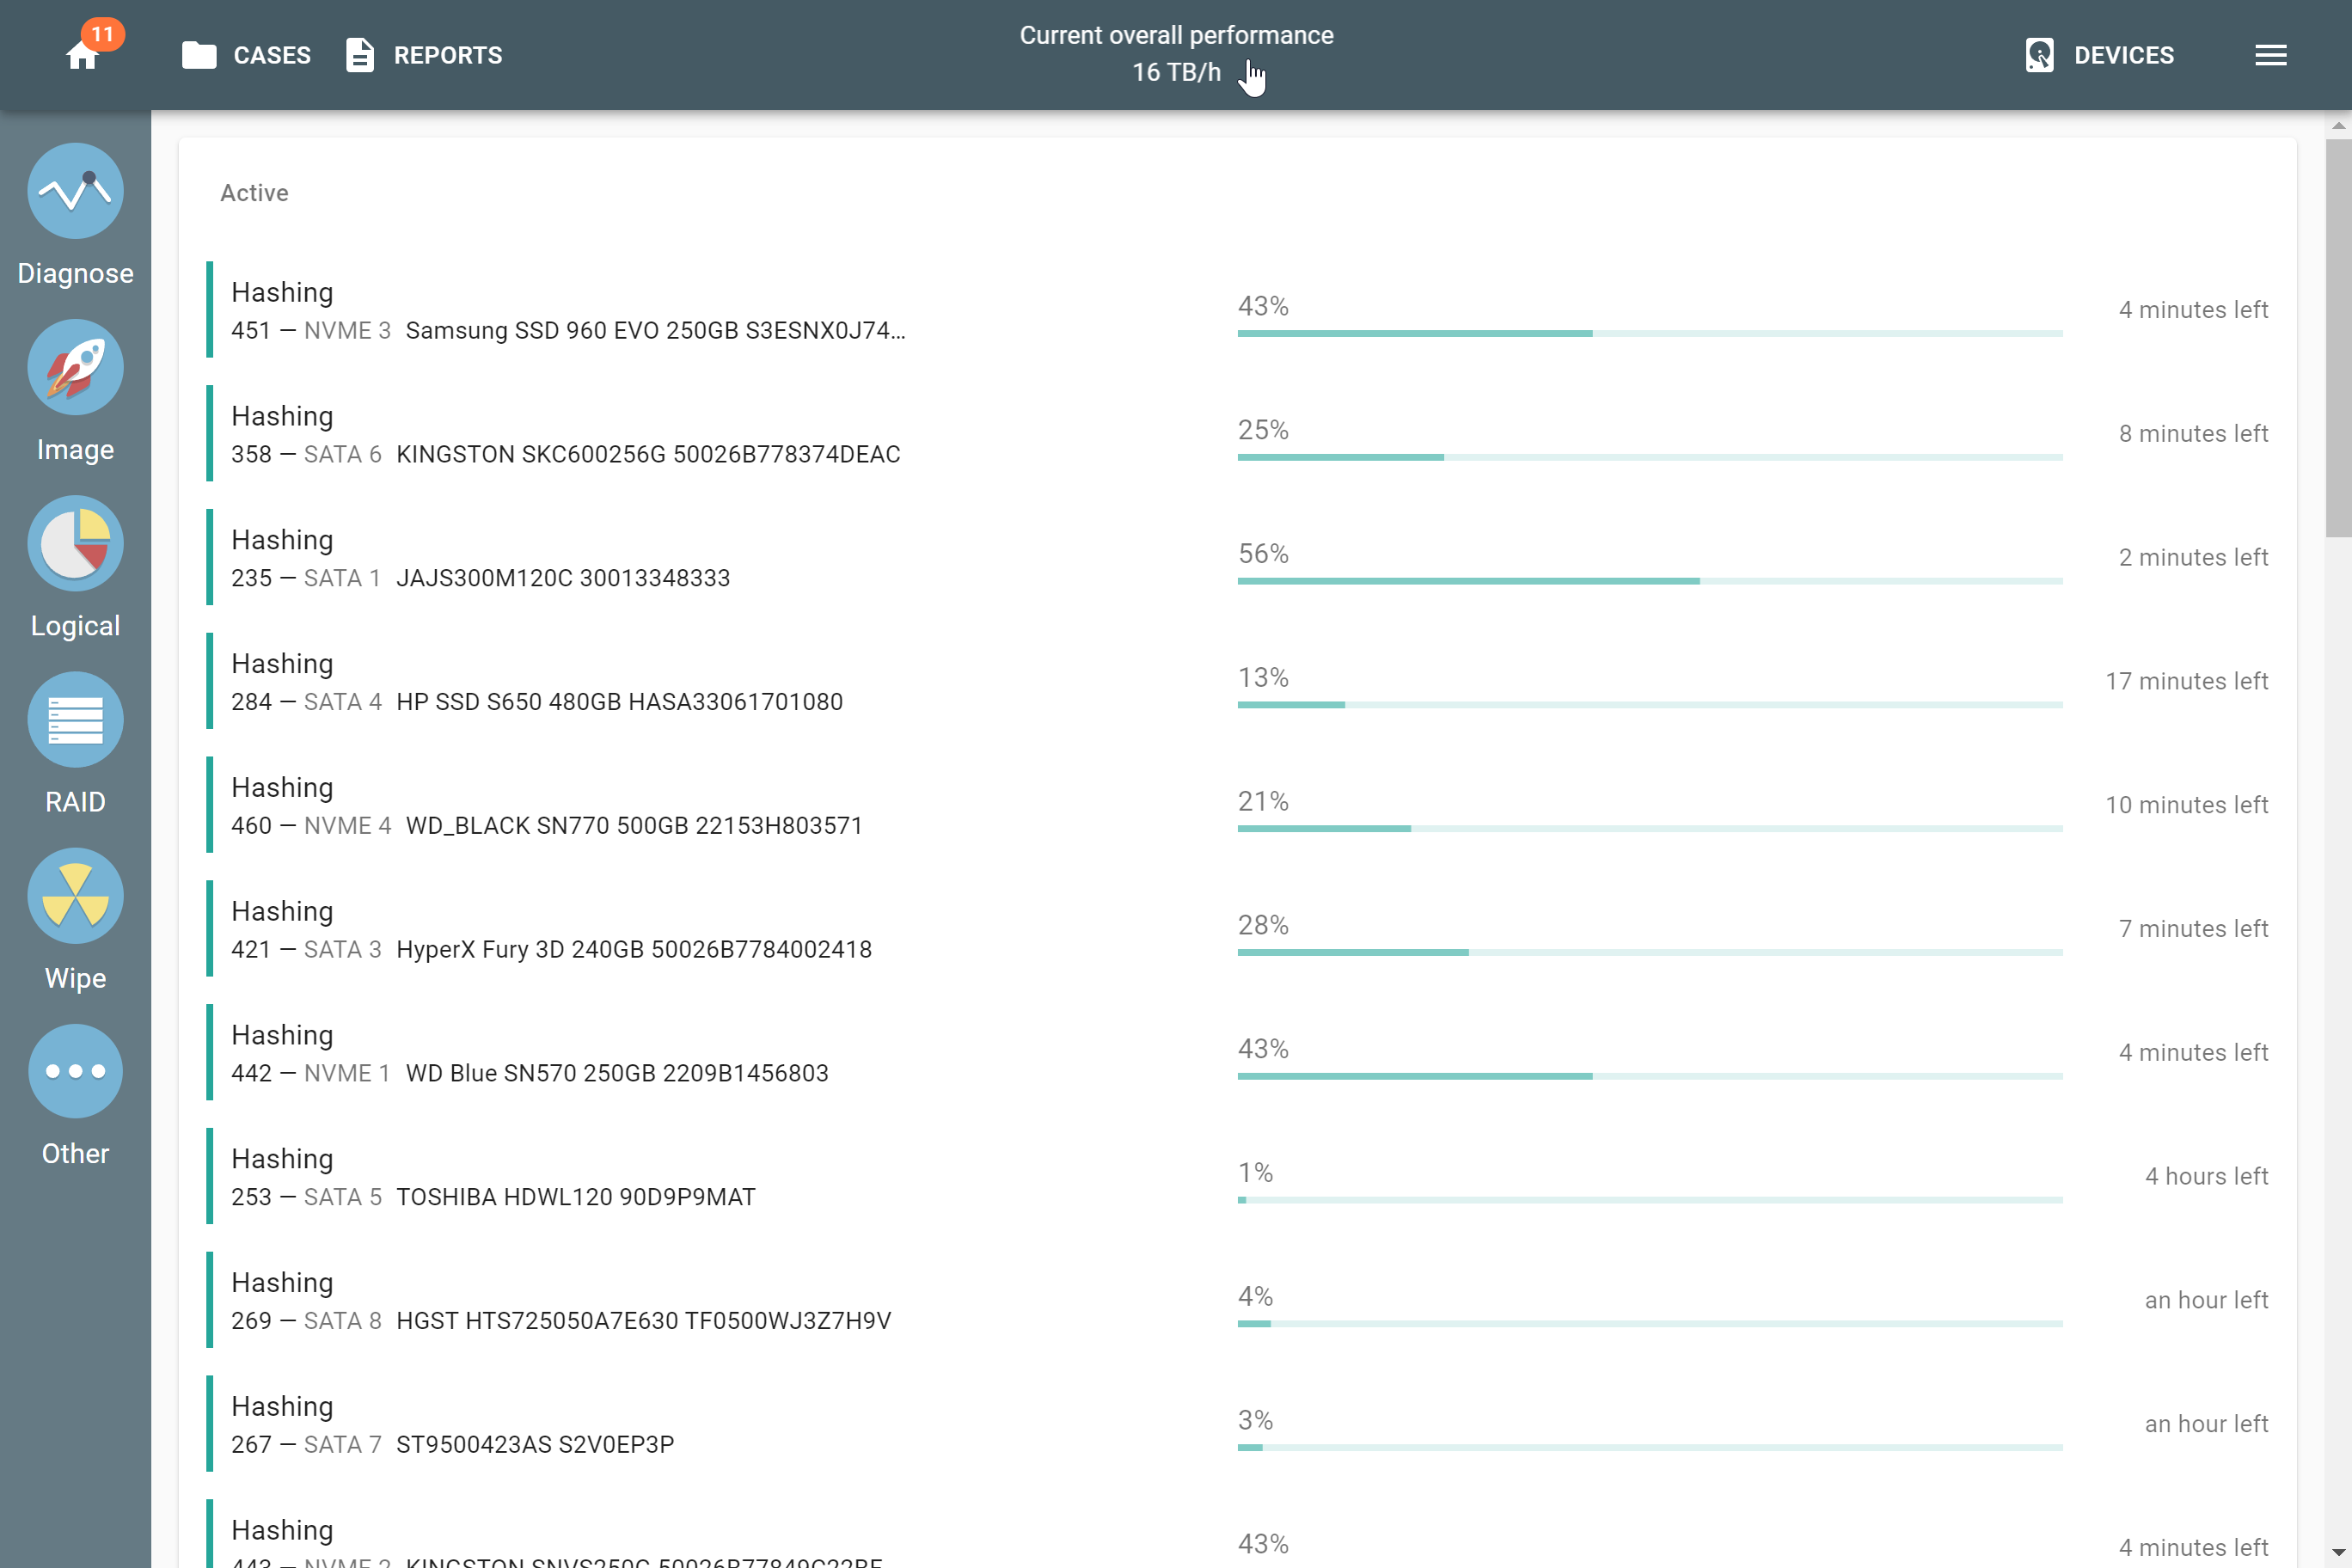
Current overall performance shows after you click the Atola logo.
6. Devices
Click the Devices button in the top panel to see all the drives connected to TaskForce to obtain maximum information about each by simply clicking it.
The Devices panel provides additional options for working with the drives: add a case for a device, re-identify or power off any device.

The Devices panel is expanded and shows all the drives connected to TaskForce.
7. Menu
The Menu contains device settings and features that regulate your use of the TaskForce unit.
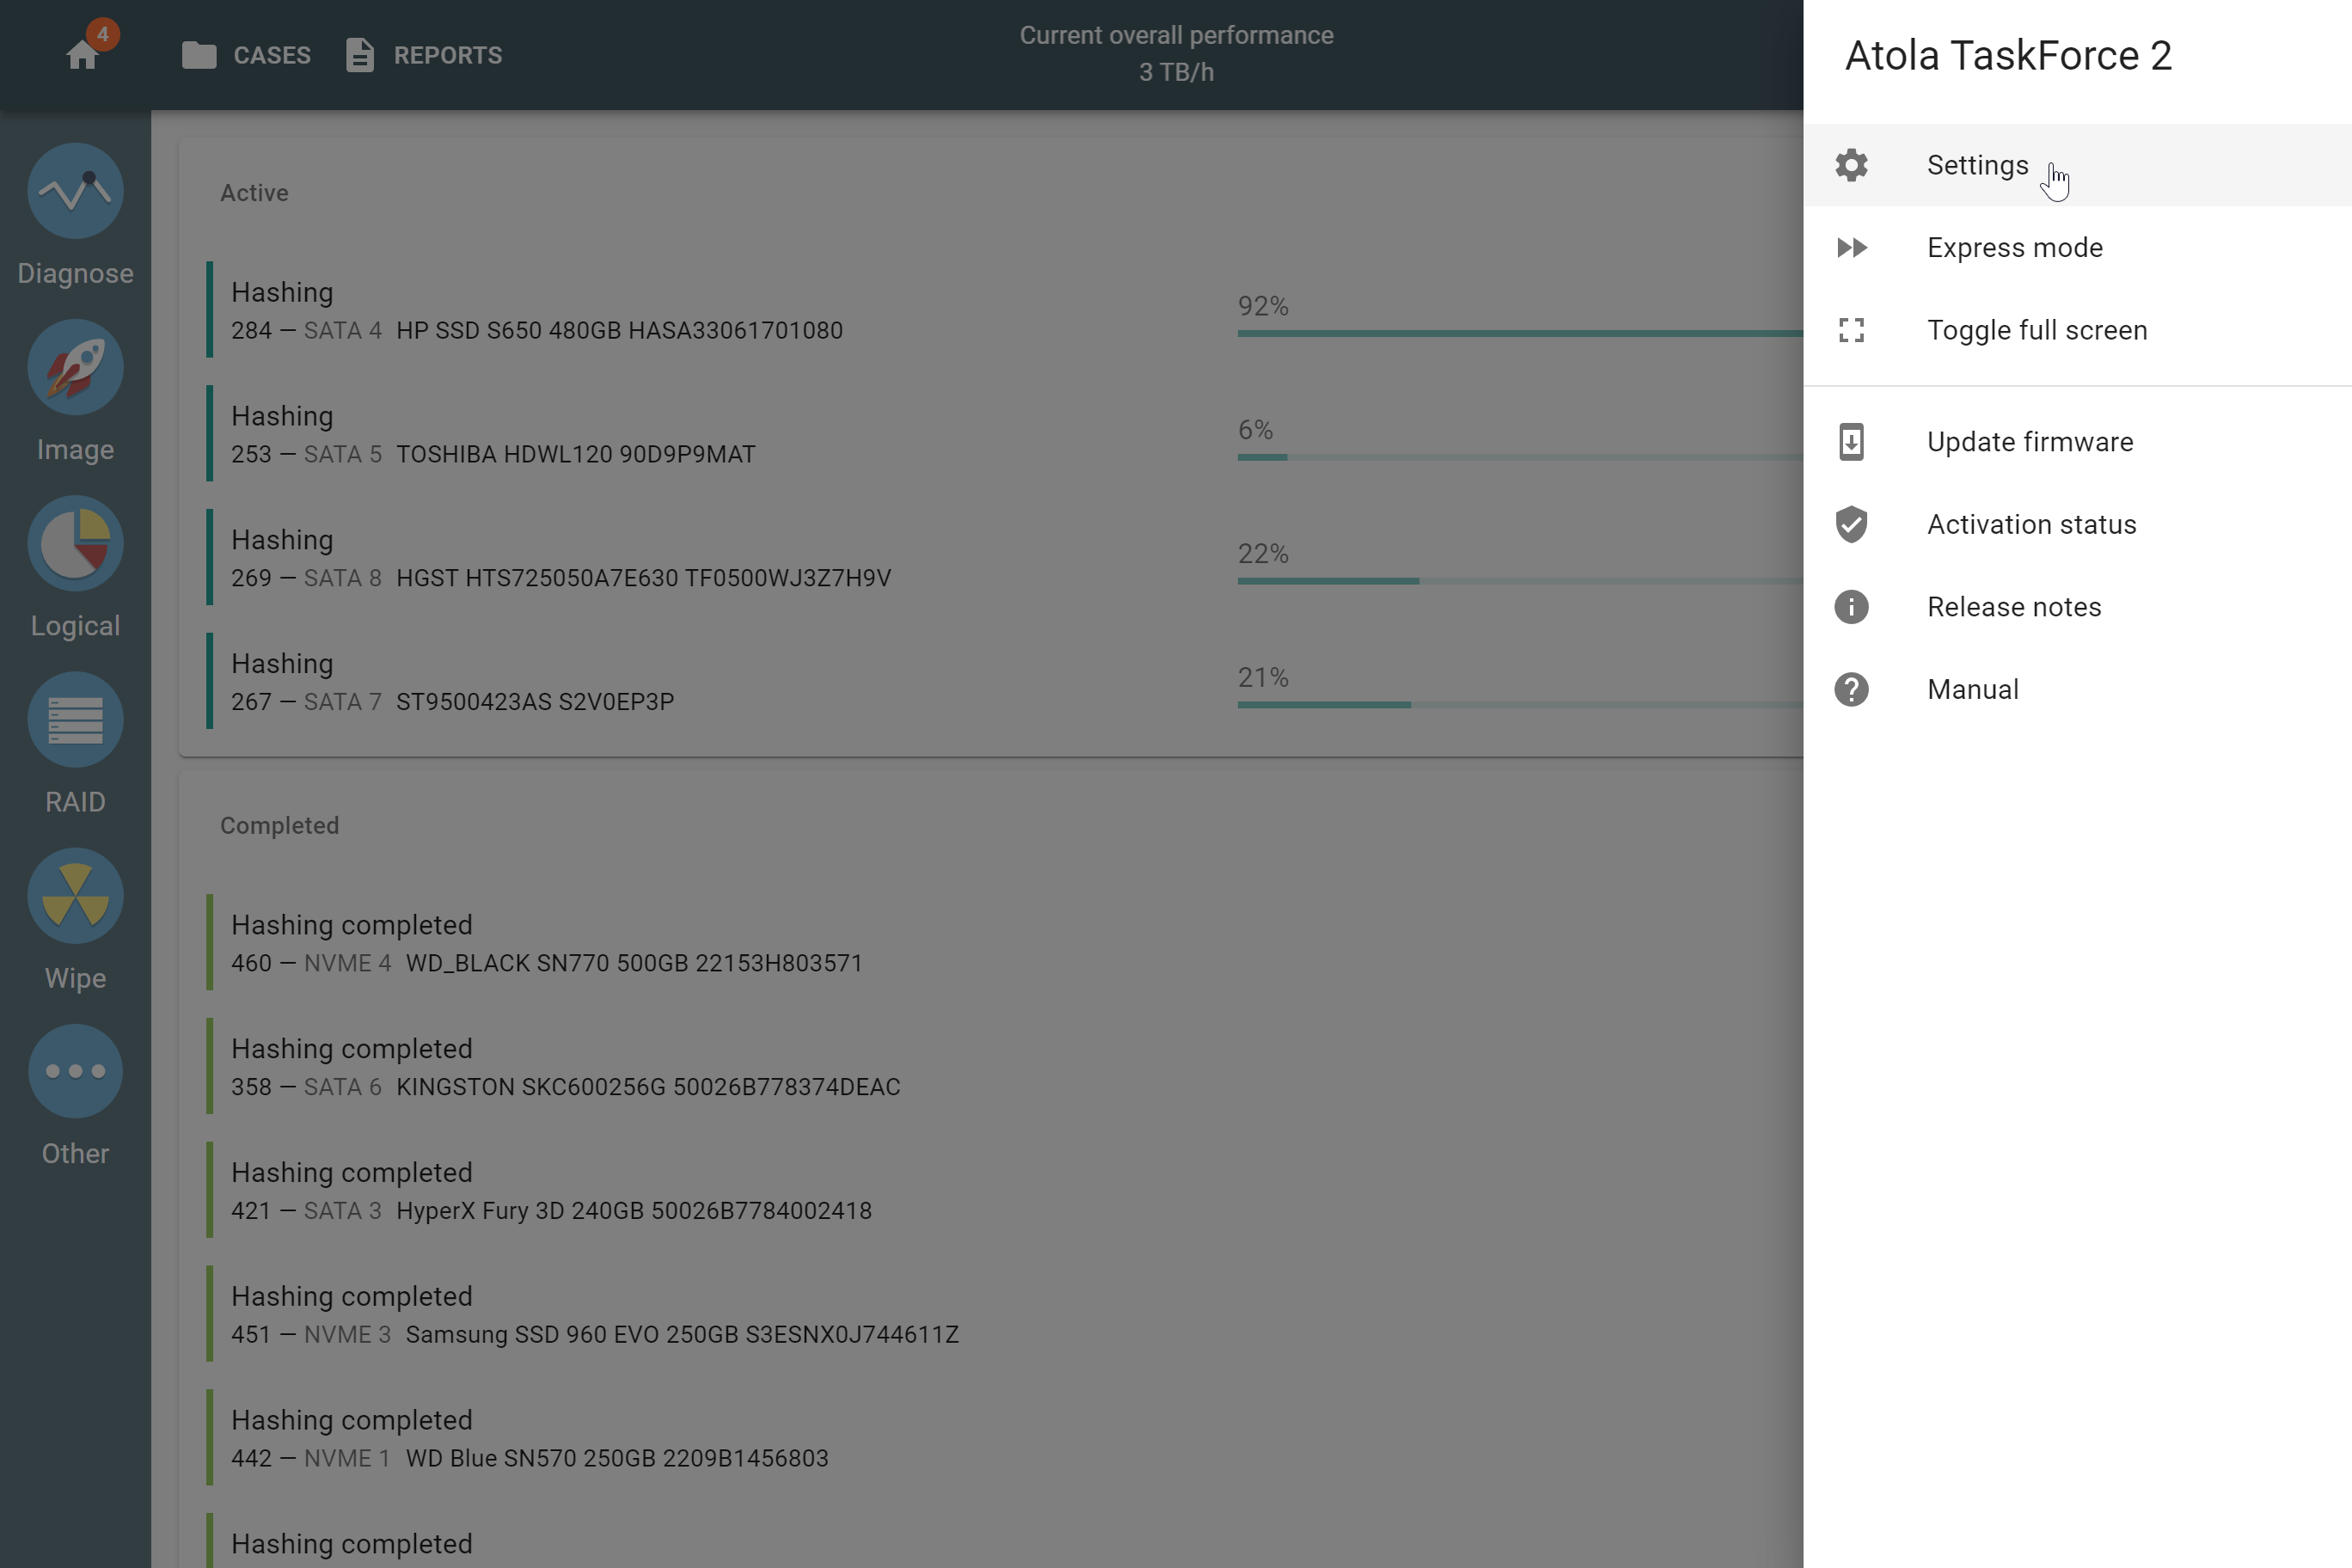
The Menu gives access to Atola TaskForce settings, express mode, full screen mode, release notes, and manual.
In Settings you can adjust the general, database, network, print, and other settings.
Express mode enables automatic launch of multiple imaging sessions on all ports that are set to source. For more details, see Express mode: self-launching imaging.
The Toggle fullscreen option is handy when working with other programs or files.
In Update firmware you can check the current TaskForce firmware, choose the update method, and perform the firmware update by selecting and downloading the firmware file.
Activation status lets you look up, reactivate the status, or extend the subscription.
In Release notes you can read the information about the most recent Atola TaskForce firmware release and track all updates and enhancements by clicking the corresponding links.