Artifact Finder
Insight's Artifact Finder feature allows early analysis of data by reading and parsing it on an evidence drive or its images. Unlike most forensic analysis tools that parse the file structure, Insight does sector-level parsing, which allows getting data even from the spaces of the drive that are not associated with any file (e.g. remnants of previously deleted documents), thus providing you with clues that are omitted by most analysis tools. Artifact Finder uses the Intel Hyperscan engine, which makes it the fastest possible tool for primary data analysis.
Insight supports multiple simultaneous artifact searches on both source and target drives.
Search for artifacts
In the sidebar, go to Artifact Finder. In the upper part of the window, there is a table with previous artifact searches performed on the current drive, including those carried out during imaging. If you want to perform another search, select the artifacts that need to be found.

The artifacts include:
- Credit cards
- Emails
- GPS coordinates
- IP
- MAC
- Phone numbers
- URL
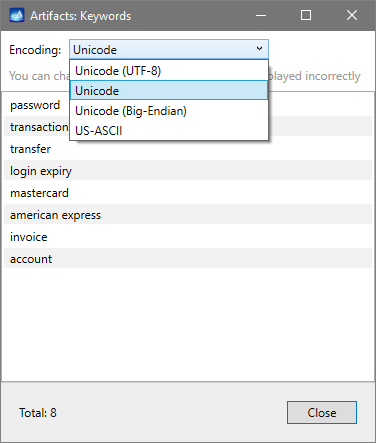
- Keywords
- Regular expressions
For each of the artifacts, not only widely known filter algorithms were applied for proper result filtering (such as the Luhn formula used to validate credit card numbers), but there have also been custom smart filters applied to eliminate false results (e.g. two slashes next to a number that has preliminarily been identified as a credit card number will eliminate it from the search results, as it is likely to be a part of a URL).
Keywords and regular expressions can be added to the search parameters in a txt file with one artifact per line. Keyword encoding can be adjusted to Unicode, Unicode (UTF-8), Unicode (Big-Endian) or US-ASCII.
Browse through the found artifacts
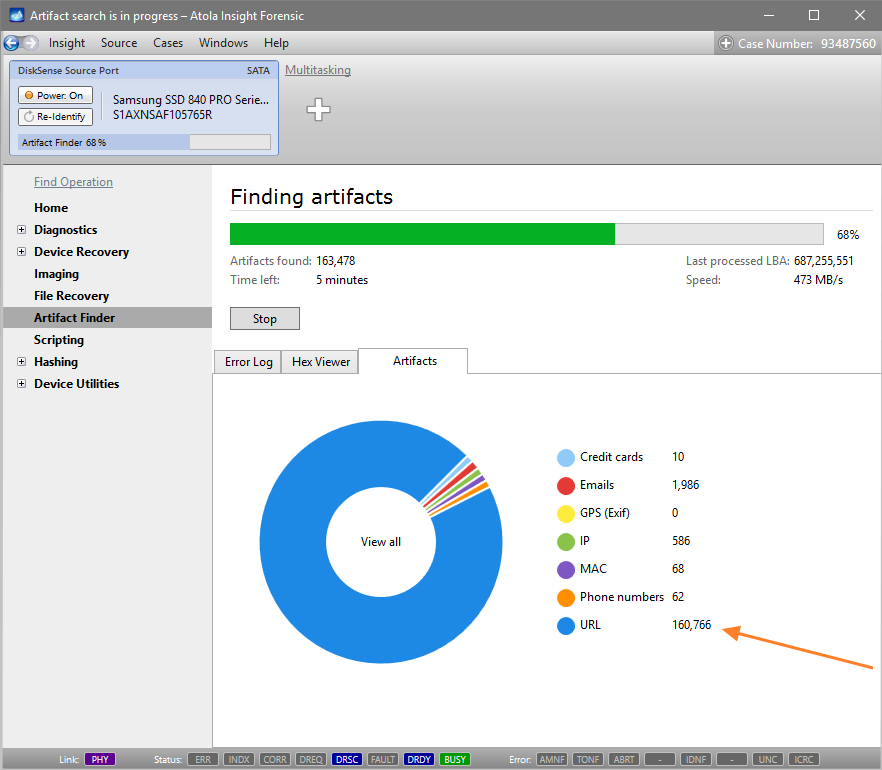
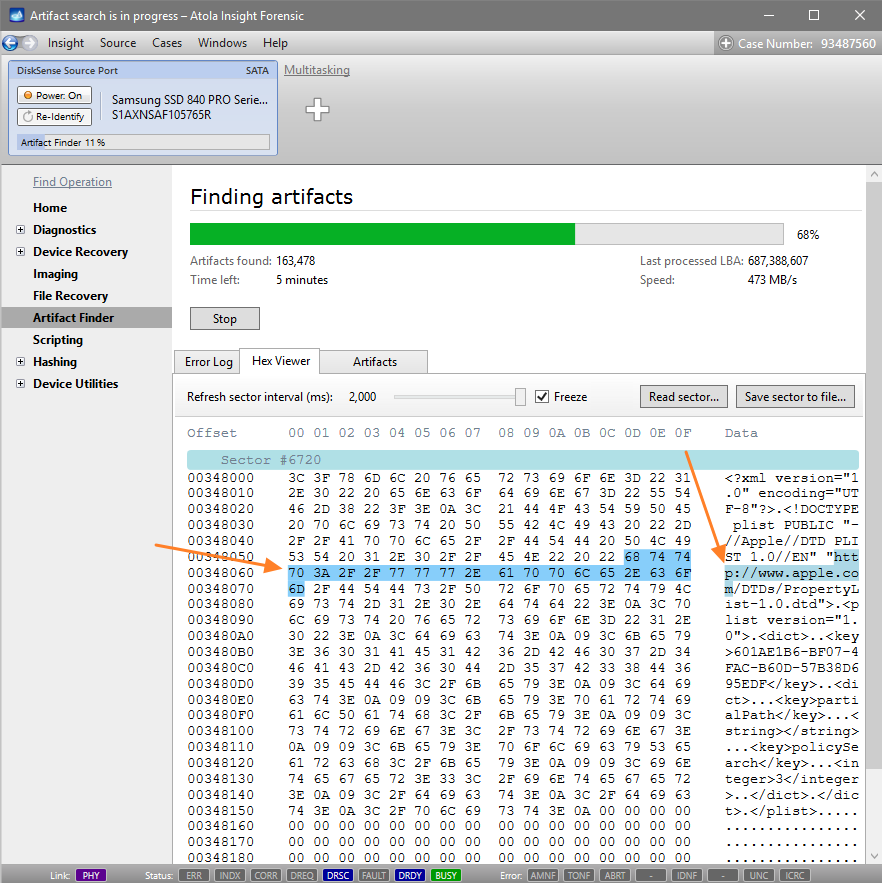
As the Artifact Finder is still running, you can look at the progress in the Artifacts tab below the progress bar and click the diagram to see the list of found artifacts. If you only want to look at a certain category, click it in the list or in the diagram.
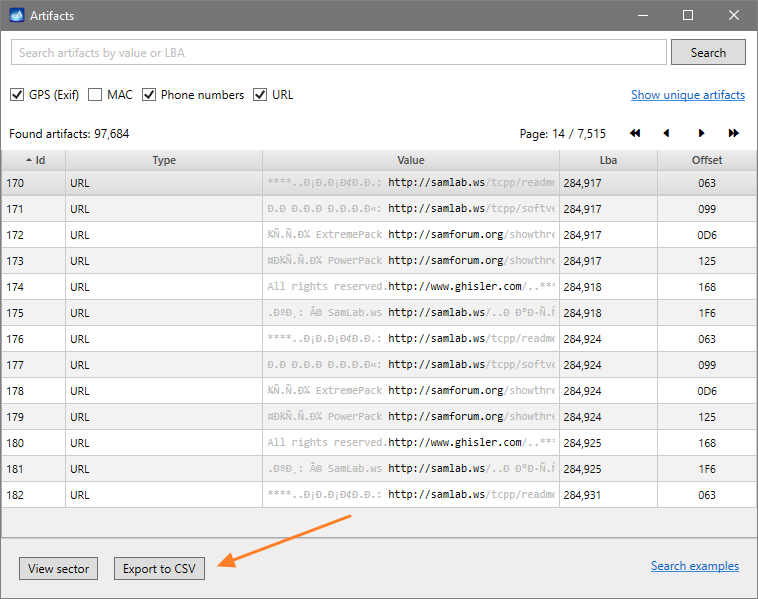
In the table, each artifact is given an Id number, each found Value is shown in the context (including 20 bytes before and 20 bytes after the artifact in grey color), the LBA and the offset are also displayed in the table to help locate the artifact.
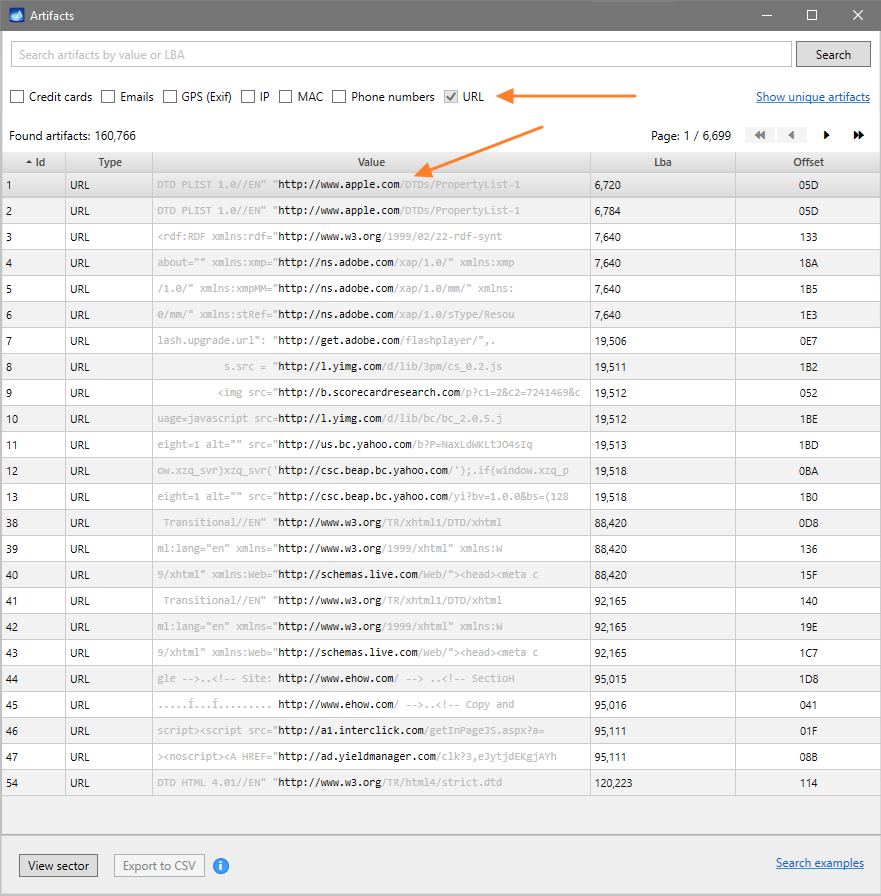
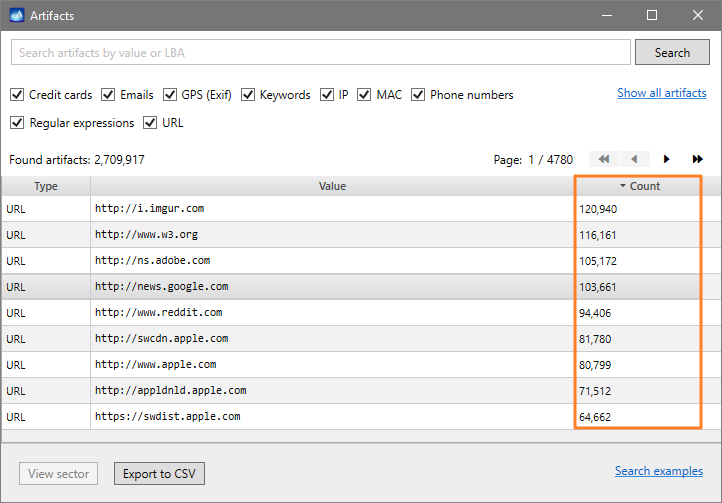
There are many options to help find, sort, filter and view the artifacts. It is possible to view one or a few categories of artifacts in one list, use the Search bar to find a specific value (search examples are provided in the bottom right corner of the window), filter results for unique values by clicking the Show unique artifacts link. It helps identify the values most frequently occurring on the drive: to sort the results click Count in the table header.
Click an artifact in the list to see the sector where it is located. This allows you to see the context in which the artifact is placed.
Export the list of found artifacts
During the search, the Export to CSV button is disabled. You can wait until the process is completed or, should it be necessary to start analyzing the current search output with an external tool, stop it, make an export, and restart the search from scratch or from the last LBA analyzed during the previous session.
To make an export:
- Click the link with the number of artifacts found during this search.
- On the Artifacts screen, select the artifacts to be exported (e.g. one or multiple artifact categories, unique artifacts or only those fitting certain search criteria), and then click the Export to CSV button.
- Select the path for the file and click Export.